
| Map of Danish marine waters | ||
| Present levels | ||
| Exceptional and harmful algal blooms | ||
Box 5. Indices for phytoplankton
parameters. Box 6. Adjustment of indices to climatic conditions.
|
| Figures
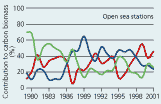
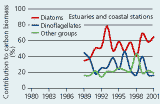
2.19 Contributions (%) of phytoplankton groups to annual average biomasses at sampling stations in open sea areas and estuaries and coastal areas of the Danish waters in the Baltic entrance area. |
 |
| Open sea areas |
 |
| Estuaries and coastal areas |
| Figures
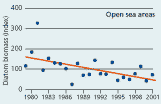
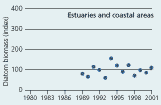
2.20 Annual averages of diatom biomass in Danish waters. Biomasses are given as indices (see box 5). |
 |
| Open sea areas |
 |
| Estuaries and coastal areas |
| Figures
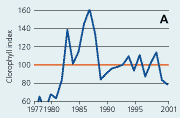
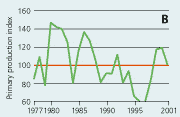
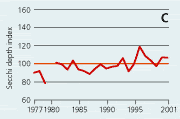
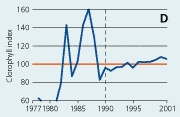
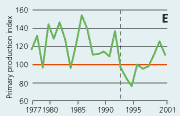
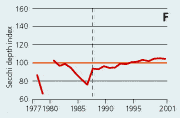
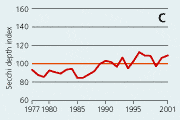
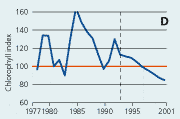
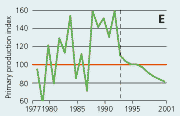
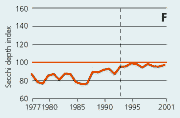
2.21 Indices for Secchi depth, chlorophyll concentrations and annual primary production in open sea areas. Indices are given for measured values (A, B and C) and adjusted for variations in climatic conditions (D, E and F). Adjustments for climatic variations are developed on data from time periods represented by hatched lines and up till 2001. Subsequently the adjustments were applied on data in all years.
|
| Measured values |
|
| Chlorophyll |
 |
| Primary production |
 |
| Secchi depth |
| Adjusted for climatic variations |
 |
| Chlorophyll |
 |
| Primary production |
 |
| Secchi depth |
| Figures
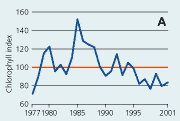
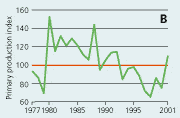
2.22 Indices for Secchi depth, chlorophyll concentrations and annual primary production in estuaries and coastal waters. Indices are given for measured values (A, B and C) and adjusted for variations in climatic conditions (D, E and F). Adjustements for climatic variations are developed on data from 1993–2001, but applied on data in all years.
|
| Measured values |
|
| Chlorophyll |
 |
| Primary production |
 |
| Secchi depth |
| Adjusted for climatic variations |
 |
| Chlorophyll |
 |
| Primary production |
 |
| Secchi depth |
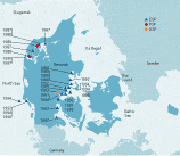
| Figure
2.23 Registered accumulations in shellfish of algal toxins in concentrations above limits for human consumption. DSP, Diarrhetic Shellfish Poison; PSP, Paralytic Shellfish Poison and ASP, Amnesic Shellfish Poison. ASP detected in 1993 was analysed by a single laboratory and has not been confirmed by other laboratories. (From Bjergskov et al. 2001).
|
 |
Phytoplankton and harmful algal blooms
Phytoplankton are the base of pelagic food webs in aquatic systems. In addition, sedimentation of phytoplankton provides an essential nutritional input to the benthic fauna. With generation times ranging from <1 day to a few days phytoplankton respond rapidly to changes in nutrient concentrations. Therefore, phytoplankton have been included in the Danish monitoring programme since 1979 as an indicator of the eutrophication status. Phytoplankton are quantified as carbon biomass determined from microscopy or indirectly as the concentration of chlorophyll a, a pigment found in all autotrophic phytoplankton organisms.
No data exists on phytoplankton biomass or chlorophyll a concentrations under pristine conditions. Therefore present levels are generally compared with background concentrations in offshore areas. For Danish waters the offshore Skagerrak chlorophyll a concentration of 1.25 µg l-1 can be applied. However, this concentration represents the maximum concentrations for the growing season (spring-late summer) (OSPAR 2001). The OSPAR assessment criteria are not operational, and the Danish assessment has therefore been based on mean chlorophyll a concentrations in March-October.
PRESENT LEVELS
In 2001 the average phytoplankton biomass varied from 35 to 405 µg
C l-1 at the 17 Danish stations sampled in 2001 and with a
long-term sampling record of more than five years. In 12 out of 17 areas
the average phytoplankton biomasses in 2001 were lower (8–61%) than
the long-term averages (Table 2.5).
In 1999 and 2000 diatoms generally dominated the phytoplankton carbon biomass with important but somewhat smaller contributions from dinoflagellates (especially in 1999) and other organisms (Figure 2.19). This pattern of dominance has, however, changed over time, in particular in open sea areas. Here diatoms accounted for <20% up to 40% of the total biomass from 1979 until 1998 while dinoflagellate contribution to biomass increased from <23% during 1979 to 1985 to 28–65% after 1986. The increasing importance of dinoflagellates has been accompanied by reduced contributions from other groups, mainly nanoflagellates.
In estuaries and coastal waters diatoms prominently dominated the phytoplankton
(35–78%) since sampling was initiated in 1989 (Figure
2.19). The contributions from dinoflagellates have varied between
16% and 46% and the importance of other groups, mainly nanoflagellates,
increased from 1989 to 1998.
Because diatoms dominate the spring bloom, of which a large fraction sediment
to the bottom, they are important for the transfer of organic matter of
pelagic origin to the benthic fauna. In addition, the input of organic
matter to the water mass below the pycnocline will affect the subsequent
development in bottom water oxygen conditions.
The biomass of diatoms has decreased significantly over the past 20 years in the open Kattegat and Belt Sea. During 1995–2000 the average biomass of diatoms in these areas was 50% of the biomass in the early 1980s. In estuaries and coastal areas no long-term trend in diatom biomass was found (Figure 2.20).
Primary production in the open sea areas has shown an overall decline with major year-to-year variations from 1977 to 1997 (Figure 2.21). The subsequent increase in primary production during 1998–2001 may be due to a reduction in the number of monitoring stations and changes in the sampling strategy in 1998. During 1993-2001 primary production was significantly correlated with runoff, wind and temperature. The primary production index adjusted to changes in climatic conditions shows a lower production during the 1990s than during the 1980s. Despite the apparent decrease in primary production from the 1980s to the 1990s, the annual primary production in the Kattegat area has increased 2- to 3-fold from the 1950s to 1984–1993, apparently as a result of eutrophication (Richardson & Heilmann 1995).
In estuaries and coastal areas primary production has decreased from 1980 to 1997 and subsequently increased during 1998-2001 (Figure 2.22). For the period 1993-2001 primary production was significantly correlated with runoff, irradiance and temperature. Index values adjusted for variations in climatic conditions showed a very consistent decline after 1993. This decline in primary production was presumably due to reduced phosphorus loading to the estuaries through the establishment of sewage treatment plants in the late 1980s and early 1990s and subsequent reduction in the nitrogen load both from point and diffuse sources.
Chlorophyll a concentrations have decreased in the open sea areas since the 1980s (Figure 2.21). However, mainly during the 1980s the year-to-year variations have been substantial and possibly related to the lack of standardised sampling strategies and methods for analyses prior to 1989. For the period 1990-2001 chlorophyll a concentrations correlated significantly with primarily irradiance during early spring and autumn. Chlorophyll a index values adjusted for variations in climatic conditions were very variable prior to 1990 and showed a general slight in-crease for the period 1990-2001. Since 1980 the concentrations of chlorophyll a in Danish open sea areas (Hansen et al. 2000) have been >50% above background concentrations (1.25 µg chl a l-1) given by OSPAR (2001).
Chlorophyll a concentrations have decreased in estuaries and coastal waters since the mid 1980s (Figure 2.22). The concentrations of chlorophyll a correlated significantly with runoff during 1993–2001. When adjusted for variations in climatic conditions, chlorophyll a index values showed a very consistent decline from 1993 to 2001.
In open sea areas the Secchi depth, a measure of water transparency, has increased since the mid-1980s (Figure 2.21). The Secchi depth adjusted for variations in climatic conditions has increased despite a similar increase in chlorophyll concentration. In estuaries and coastal areas the decline in chlorophyll concentrations since the mid-1980s has been accompanied by in-creased Secchi depth (Figure 2.22).
EXCEPTIONAL AND HARMFUL ALGAL BLOOMS
Several potentially toxic and harmful species of algae are common minor
components of the phytoplankton communities in Danish waters. In some
years, however, they form conspicuous blooms that may have severe effects
on other organisms or on the tourist and fishing industries (Table
2.6). Blooms of some species, e.g. Chrysochromulina polylepis,
have occurred only once, while blooms of other species are recurring,
e.g. Karenia mikimotoi and Chattonella sp. The latter
was found in high concentrations for the first time in 1998.
Potentially harmful species are registered and quantified in the national
monitoring programme. In addition, the commercial bivalves fishermen and
the mussel industry are undertaking monitoring of toxic phytoplankton
and algal toxins in bivalve shellfish in all areas where shellfish are
harvested. Areas may be closed for fishing of shellfish if toxic algae
are found in concentrations above given limits (Bjergskov
et al. 2001) or if algal toxins are detected in shellfish in concentrations
above the limit for human consumption. Most registrations of shellfish
containing algal toxins in concentrations above limits are from the 1980s
and the early 1990s and from the eastern coast of Jutland (Figure
2.23) where the fished shellfish amounts to only one third of the
catches in the Limfjorden in northern Jutland.
Table 2.5
Year 2001 average phytoplankton biomasses and biomasses
relative to long–term averages for the given time periods at all
Danish stations with quantitative phytoplankton sampling and a history
of more than five years of sampling. Figures show percentage ![]() increase or
increase or ![]() decrease in biomass relative to long-term
average.
decrease in biomass relative to long-term
average.
| Geographical area | Period |
2001 biomass µg C l-1 |
2001 relative to long- term average |
| Sønderho, east | 1990–2000 |
147 |
37 |
| Ringkøbing Fjord | 1989–2000 | 45 |
8 |
| Nissum Bredning | 1985–2000 | 117 |
25 |
| Løgstør Bredning | 1985–2000 | 133 |
4 |
| Skive Fjord | 1985–2000 | 255 |
10 |
| Ålborg Bugt | 1989–2000 | 67 |
43 |
| Hevring Bugt | 1989–2000 | 147 |
15 |
| Århus Bugt | 1989–2000 | 113 |
10 |
| Mariager Fjord | 1989–1996 | 230 |
25 |
| Horsens Fjord | 1989–2000 | 138 |
13 |
| Vejle Fjord | 1989–2000 | 176 |
14 |
| Kolding Fjord | 1989–2000 | 405 |
10 |
| Little Belt, northern part | 1989–2000 | 112 |
20 |
| Gniben | 1979–2000 | 41 |
61 |
| Little Belt, southern part | 1989–2000 | 121 |
14 |
| Roskilde Fjord | 1992–2000 | 44 |
40 |
| The Sound, northern part | 1979–2000 | 35 |
31 |
Table 2.6
Blooms of potentially toxic phytoplankton species
or exceptional blooms in Danish waters. Years with major blooms are given,
and the most significant ones marked in bold. Months indicate the most
frequent time of year for blooms. Maximum abundance and effects refer
to the most extreme episodes registered.
1 = Gyrodinium aureolum
2 = Maximum biomass given was total biomass of all cyanobacteria
including Aphanizomenon sp. and Anabaena sp. registered
in the national monitoring programme. Locally, much higher biomasses may
have occured in accumulations along the shore.
| Species | Year |
Month(s) | Geo-graphical area |
Maximum abun-dance or biomass |
Effects |
| Chattonella spp. | 1998,
2000, 2001 |
Jan-May | Århus Bugt, Danish west coast, Skagerrak, Kattegat |
23 mill. l-1 |
Fish kills |
| Chryso-chromulina spp. | 1988, 1992 |
May | Kattegat, Belt Sea | 100 mill. l-1 |
Fish kills, dead benthic inverte-brates, macrophytes affected |
| Dictyocha
speculum |
1983,
1999 |
May-Jun | Little Belt, Alssund | 25
mill. l-1 |
Fish kills in maricultures associated with bloom
|
| Gymno-dinium chloro-phorum | 1999 |
Aug-Dec | Nissum Bredning, W Kattegat ,Skagerrak | 15 mill. l-1 |
None reported |
| Karenia
mikimotoi 1 |
1968,
1981, 1997 |
Aug-Oct | Danish
west coast, Kattegat, Belt Sea |
8.6
mill. l-1 |
Dead benthic inverte-brates |
| Nodularia spumigena 2 |
1975, 1976, 1992, 1994, 1995, 1997, 1999, 2001,
2002, 2003 |
Jul-Aug | Århus Bugt, W Kattegat, Belt Sea, W Baltic | 869 µg C l-1 |
Dogs dying after swimming in water |
| Phaeocystis sp. | Yearly
2000 |
May-Jun | Danish west coast |
Foam on beaches |
|
| Proro-centrum minimum |
1983, 1984, 1987, 1989, 1992, 1993, 1994, 1995,
1996, 1997, 1999 |
Jul-Oct | Most Danish estuaries and coastal areas | 53 mill. l-1 |
None reported |
| Pseudo-nitzschia spp. | 1992,
1999, 2000 |
May-Nov | Kattegat, Belt Sea SW Kattegat Danish west coast |
346 µg C l-1 |
None reported |
| Box 5 Indices for phytoplankton parametres |
| For each sampling
station an average value is calculated for individual years and a
global average of all annual averages. The annual indices are calculated
as: • Index (year, station) = average (year, station) x 100/global average (station) • Subsequently a national index for a given year is calculated as the average of indices for all stations that year. • Only stations with a minimum of 5 years sampling with a frequency of >5 samples year-1 were included. See figure 2.20 |
| Box 6 Adjustment of indices to climatic conditions |
| Indices of chlorophyll
a concentrations, primary production and Secchi depth were
correlated with indices of climatic conditions (e.g. runoff, wind,
irradiance and temperature) by multiple linear regression. The model
was optimised with respect to indices of climatic conditions (e.g.
lag phase for runoff, irradiance during seasons where nutrients were
expected not to limit primary production) and time period included
in the regression. Subsequently, indices adjusted for variations in climatic conditions were found as: Adjusted index = measured index – modelled value + 100. The adjusted indices represent predicted indices under identical climatic conditions and thus serve to illustrate variations over time due to other factors than differences in climatic conditions. See figure 2.21 |
| | Top | |
| Next
| |


