
| Map of Danish marine waters | ||
| Land-based sources | ||
| Input from the atmosphere | ||
| Nutrient input from adjacent seas and neighbouring countries | ||
| Nutrient budget for the Kattegat-Belt Sea Area | ||
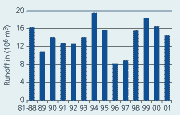
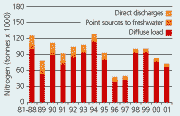
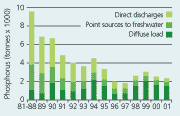
| Figures 2.8 Annual freshwater runoff, and the total annual nitrogen and phosphorus load to Danish coastal waters in the period 1989-2001, divided between diffuse load, point sources to freshwater and direct point sources to marine waters. An estimate of the average annual load in the 1980s is shown for comparison. From Bøgestrand (2001).
|
 |
 |
| Annual
nitrogen load |
 |
| Annual
phosphorous load
|
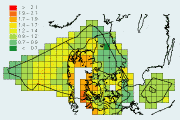 |
| Figure
2.9 The atmospheric wet and dry deposition of inorganic nitrogen (NOx+NHx) in tonnes N km-2 at Danish sea areas in 2001. Grid size 30 km x 30 km. (From Ærtebjerg et al. 2002).
|
| Figures
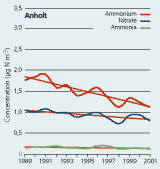
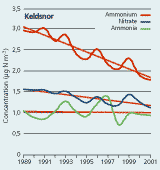
2.10 Annual means for the period 1989-2001 of concentrations of ammonia (green), particle bound ammonium (red) and sum-nitrate (blue) at Anholt in the middle of Kattegat and Keldsnor in the southern Belt Sea. (From Ellermann et al. 2002).
|
 |
| Anholt |
 |
| Keldsnor |
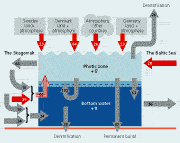 |
| Figure
2.11 Transport of biological active nitrogen in the transition area between the Skagerrak and the Baltic. Loss to the bottom includes denitrification (30,000 tons) and permanent burial (47,000 tons). Period covered: see text.
|
Inputs from land-based sources, the atmosphere and adjacent seas
The main increase in nutrient loads from land and atmosphere took place long before comprehensive load compilations were initiated in the late 1980s. Kronvang et al. (1993) recorded a 3.7% annual increase in the export of nitrogen (N) during the period 1967–1978 in 6 Danish rivers draining mainly agricultural catchment areas. They also estimated that the annual riverine N load to Danish coastal waters in the late 1960s was only about 60% of that in the 1980s. From long term time series of N and phosphorus (P) concentrations in a few North European rivers the EEA (2001) estimated that the N load has at least doubled from the 1950s to the 1980s in the North Sea – Baltic Sea region, and the P load increased fourfold from the 1940s to the 1970s. The EEA (2001) also estimated an increase in atmospheric N deposition of 80% and 100% from the late 1940s to the 1980s for the North Sea and Baltic Sea, respectively. In recent years the load to Danish waters has decreased, especially for P, but also for N from land and atmospheric sources.
LAND-BASED SOURCES
Detailed Danish nutrient load compilations were initiated in 1988. The
development up to 2001 is shown in Figure 2.8. Nitrogen
(N) comes primarily from leakage from agricultural soils, while point
sources play a minor and decreasing role. Earlier, phosphorus (P) came
mainly from point sources, e.g. domestic and industrial wastewater. However,
improving sewage plants with P (and N) removal during the late 1980s –
early 1990s has reduced the point source P load to surface waters (fresh
and marine) by nearly 90%. This has reduced the overall P load and N load
to marine waters by 60% and 14%, respectively, compared to 1990, and today
the diffuse P load is higher than the point source P load (Bøgestrand
2001, Ærtebjerg et al.
2002).
The diffuse P and N loads follow the runoff creating large seasonal and inter-annual variations. For example, the N load might be twice as large in wet years (1994-1995) as in dry years (1996-1997) (Figure 2.8), which masks long term trends in loads. However, during the period 1990-2001 the diffuse N load corrected for inter-annual variations in runoff has decreased about 21% due to reduced use of N in agriculture (Bøgestrand 2001, Ærtebjerg et al. 2002).
The nutrient and BOD5 loads to different Danish coastal areas in 2001 are shown in Table 2.1, and source apportionment for 2000 is shown in Table 2.2. The diffuse background load was about 10% of the total load for both N and P in 2000. Agriculture accounted for 88% of the N load and 45% of the P load to fresh- and marine waters. Direct point sources to marine waters accounted for 4% and 17% of the N and P load, respectively.
INPUT FROM THE ATMOSPHERE
The atmospheric deposition of inorganic nitrogen (NOx and NHx) is important
on large sea surfaces, but insignificant in small estuaries, compared
to other N sources. For the Kattegat and Belt Sea the atmospheric N deposition
makes up about 30% of the total N load from surrounding land and atmosphere.
The distribution of the deposition in 2001 on the Danish seas is shown
in Figure 2.9.
During the period 1989–2001 there is a decrease in the air concentration
of N bound to particles and a tendency to a decrease in deposition of
about 15% (Figure 2.10) (Ellerman
et al. 2001; Ærtebjerg
et al. 2002).
About 40% of the N deposition on all Danish marine waters in 2000 were in the reduced form (NHx), which stems from ammonia evaporation from agricultural husbandry. The other 60% were in the form of oxidised nitrogen (NOx) from the combustion of fossil fuels. About 11% of the total deposition on Danish marine waters came from Danish emissions, varying from 3% in the southern Belt Sea to 20% in the Skagerrak. Emissions from shipping made up 7% of the total deposition (Ellerman et al. 2001).
NUTRIENT INPUT FROM ADJACENT SEAS AND NEIGHBOURING
COUNTRIES
The exchange of water and nutrients between the Baltic Sea and Skagerrak
through the Kattegat and the Belt Sea is intense. The annual freshwater
net surplus of about 475 km3 from the Baltic Sea passes through
the Danish straits and Kattegat to the Skagerrak/North Sea. The average
annual net transports of N and P in the period 1974-1999 are shown in
table 2.3 together with the loads from the atmosphere
and surrounding countries in the pe-riod 1989–1996. The gross transports
are much larger, especially at the Skagerrak border. Here an inflow of
deep water rich in inorganic nutrients enters the Kattegat bottom water,
and eventually is mixed to the surface water and re-exported to the Skagerrak,
either in inorganic or organic form, dependent on the season. Due to shallow
sills the inflow from the Baltic Sea to the Danish straits is Baltic surface
water, which is low in bio-available
nitrogen, due to the long residence time (about 25 years) of the Baltic
Sea.
Evidently, there is a substantial net supply of both N and P to the
Kattegat – Belt Sea area of on average about 125,000 tonnes N and
5,800 tonnes P per year. Some of the nitrogen is removed by denitrification.
The rest is accumulated in the sediments together with P, some of it permanently,
but much of it in labile pools. Especially large pools of phosphate are
released from sediments to the overlying water column during summer and
autumn, when the sediments become partly anoxic
(Rasmussen et al., 2003).
The Danish nutrient load to the North Sea, Skagerrak and Baltic Proper
is small (Table 2.3.) compared to the advective
transports and load from other countries. For example the Danish nitrogen
load to the North Sea (including estuaries and the Wadden Sea) is 10–15%
of the riverine load to the German Bight. Much of this is transported
north along the Danish coast with the Jutland Coastal Current, which annually
transports about 160,000 tonnes dissolved inorganic nitrogen (DIN) from
the German Bight to Skagerrak. Episodically some of this water and associated
nutrients might enter the Kattegat in some years, but it is generally
exported to the North Atlantic with the Norwegian Coastal Current.
Load from the surrounding land dominates the nutrient budgets in the Danish estuaries. Dependent on the residence time, 12% to 95% of the N received, is exported from the estuaries to the open coastal areas. In the beginning of the 1990s, after reduction of the P-load, the estuaries exported more P than they actually received from land, the excess P coming from the sediment pools. In the latest years the P export from the estuaries generally equals the load from land (Henriksen et al. 2001).
NUTRIENT BUDGET FOR THE KATTEGAT – BELT
SEA AREA
An average annual nitrogen nutrient budget has been established for the
Kattegat – Belt Sea area to evaluate the significance of the different
contributions (Figure
2.11, Table 2.4). In the
budget the land based nitrogen loads from Denmark, Sweden and Germany
given in Table 2.3 are used. However, instead of
the atmospheric deposition in the period 1989-96 the average deposition
1999–2001 was chosen, as these estimations are more reliable. The
sources of emissions to the atmosphere were identified, and the contributions
to the deposition from Denmark, Germany and Sweden added to their respective
riverine and point source loads to determine the direct loads from the
surrounding countries. The gross advective transports from the Baltic
Sea and the Skagerrak in the period 1974–1999 were used instead
of the net transports given in Table 2.3 (Ærtebjerg
et al. 2002). Determined from the supply of total-N the Danish contribution
to the Kattegat – Belt Sea area amounts to 12% (Table
2.4).
The bio-availability of the nitrogen in the different sources was calculated from measured concentrations of inorganic nitrogen and nitrogen built into phytoplankton, and compared to experimental results (Kaas et al. 1994). Including the bio-availability of the nitrogen sources in the budget increased the Danish contribution to 25% of the gross supply to the area (Figure 2.11, Table 2.4). However, some of the nitrogen supplied from the Skagerrak actually originates from the Kattegat and some is removed by denitrification or exported to the Baltic Sea. Taking this into account in-creases the Danish contribution of bio-available nitrogen to 32%, the direct contributions from Sweden and Germany to 11% each, the contributions from the Baltic Sea and the Skagerrak to 14% and 19% respectively, and the contributions from other European countries via the atmosphere to 13% (Figure 2.11, Table 2.4) (Ærtebjerg et al. 2002).
Table 2.1
Runoff, total nitrogen, total phosphorus and BOD5
load from Denmark to the main sea areas in 2001. Compiled from Ærtebjerg
et al. 2002.
| Sea area | Drainage area | Runoff | Nitrogen | Phosphorus | BOD5 | |
| km2 | mm | 106 m3 | tonnes | tonnes | tonnes | |
| North Sea | 10,860 | 449 | 4,852 | 17,500 | 530 | 6,500 |
| Skagerrak | 1,098 | 420 | 462 | 2,300 | 100 | 1,500 |
| Kattegat | 15,852 | 347 | 5,490 | 28,100 | 810 | 12,700 |
| Belt Sea | 12,346 | 241 | 3,061 | 20,400 | 670 | 10,500 |
| The Sound | 1,709 | 170 | 292 | 2,200 | 190 | 1,300 |
| Baltic Sea | 1,206 | 221 | 266 | 2,300 | 50 | 600 |
| Total | 43,070 | 335 | 14,423 | 72,800 | 2,340 | 33,200 |
Table 2.2
Source apportionment of the Danish nitrogen (N),
phosphorus (P) and BOD5 load to coastal waters in 2000. Compiled from
Bøgestrand (2001) and
Danish EPA (2001).
| Sources | Nitrogen | Phosphorus | BOD5 | Nitrogen | BOD5 | |
| t yr-1 | t yr-1 | t yr-1 | % | % | % | |
| Riverine inputs | ||||||
| Diffuse load | ||||||
| Background | 8,500 | 290 | 7,700 | 10.2 | 11.4 | 21.2 |
| Agriculture | 73,700 | 1,150 | 9,200 | 88.4 | 45.1 | 25.3 |
| Settelments | 1,000 | 220 | 3,850 | 1.2 | 0.3 | 10.6 |
| Point sources to freshwater | ||||||
| Sewage plants | 2,475 | 250 | 1,800 | 3.0 | 9.8 | 5.0 |
| Industry | 25 | 5 | 35 | - | 0.2 | 0.1 |
| Rainwater overflows | 590 | 150 | 1,700 | 0.7 | 5.9 | 4.7 |
| Freshwater aquaculture | 2,390 | 90 | 3,400 | 2.9 | 3.5 | 9.4 |
| Retension in freshwater | -8,880 | -35 | -85 | -10.7 | -1.4 | -0.2 |
| Total riverine load | 79,800 | 2,120 | 27,600 | 95.7 | 83.1 | 75.9 |
| Direct point sources | ||||||
| Sewage plants | 2,180 | 295 | 1,500 | 2.5 | 11.6 | 4.1 |
| Industry | 870 | 55 | 4,900 | 1.0 | 2.2 | 13.5 |
| Rainwater overflows | 170 | 45 | 500 | 0.2 | 1.8 | 1.4 |
| Mariculture | 325 | 35 | 1,850 | 0.4 | 1.4 | 5.1 |
| Total direct load | 3,545 | 430 | 8,750 | 4.3 | 16.9 | 24.1 |
| Total load | 83,345 | 2,550 | 36,350 | 100 | 100 | 100 |
Table 2.3
The average annual net supplies of N and P to Kattegat
and the Belt Sea in 103 tonnes year-1. Negative values mean transport
out of the area. Based on Rasmussen
et al. (2003).
| Den-mark | Swe-den | Ger-many | Atmos-phere | Baltic Sea | Skager-rak | Sum | |
| Nitro-gen | 60 | 26 | 12.5 | 44.5 | 150 | -165 | 128 |
| Phos-phorus | 3.38 | 0.54 | 0.35 | 11.44 | -9.88 | 5.83 |
Table 2.4
Nitrogen sources to the Kattegat and Belt Sea in 1,000
tonnes per year. See text for period covered.
| Total nitrogen | Bio-available nitrogen | Corrected for re-circulation | Percentrage contributions | |
| Denmark | 70 | 64 | 64 | 32 % |
| Sweden | 28 | 23 | 23 | 11 % |
| Germany | 24 | 23 | 23 | 11 % |
| Other countries via the atmosphere | 26 | 26 | 26 | 13 % |
| Skagerrak | 223 | 89 | 32 | 19 % |
| Baltic Sea | 217 | 28 | 28 | 14 % |
| Total | 588 | 253 | 203 | 100 % |
| Danish contribution | 12 % | 25 % | 32 % |
| | Top | |
| Next
| |


