
| Assessment | ||
| Climate | ||
| Hydrography | ||
| Nutrient inputs | ||
| Nutrient concentrations, ratios and limitation | ||
| Phytoplankton and harmful algal blooms | ||
| Zooplankton | ||
| Oxygen depletion | ||
| Degradation of organic matter in eustuarine sediments | ||
| Submerged aquatic vegetation | ||
| Softbottom macrobenthos | ||
| Fish kills | ||
| Map of Danish marine waters | ||
| Oxygen | ||
| Nitrogen | ||
| Phosphorous | ||
| Internal nutrient load | ||
| Figure 2.28 |
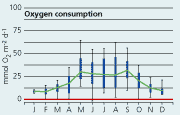 Box-Whiskers plot of the seasonal variations in sediment oxygen consumption/respiration expressed as the numerical magnitude of the O2 flux measured in darkness. The dataset is a compilation of observations from 6 estuaries each represented with 3 stations sampled 16 times over a two-year period. Median (line), 25% and 75% quantiles (boxes) and 10% and 90% quantiles (bars) are shown. |
Figures
2.29 |
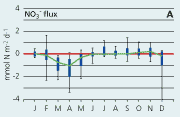
| Nitrate - A |
 |
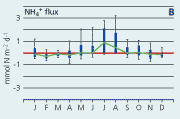
| Ammonium - B |
 |
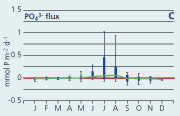
| Phosphate - C |
 |
| Figure 2.30 |
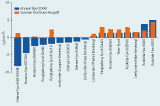 |
| Internal nitrogen supply in 2000 at 17 stations representing 6 types of estuaries, Roskilde Fjord, Odense Fjord, Horsens Fjord, Ringkøbing Fjord, Limfjorden and Skive Fjord, shown for the entire year (annual flux) and for the months of June, July and August (summer flux). Positive values indicate net release, and negative values indicate consumption. |
| Figure 2.31 |
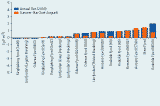 |
| Internal phosphorus supply in 2000 at 17 stations representing 6 types of estuaries, Roskilde Fjord, Odense Fjord, Horsens Fjord, Ringkøbing Fjord, Limfjorden and Skive Fjord, shown for the entire year (annual flux) and for the months of June, July and August (summer flux). Positive values indicate net release, and negative values indicate consumption. |
Degradation of organic matter in estuarine sediments
In marine sediments, organic matter is mainly degraded through bacterial processes, by which N and P bound in organic compounds as a result of primary production are released once again.
Up to half of the bacterial degradation taking place in the sediments proceeds through oxygen respiration (i.e. aerobically). The remaining degradation takes place anaerobically through respiration of nitrate, iron, manganese or sulphate (Jørgensen 1996).
Besides the release of CO2, NH4+ and PO43-, anaerobic degradation results in the formation of waste products (such as hydrogen sulphide from sulphate respiration) that are ultimately oxidised, thereby consuming the exact amount of oxygen that would have been used if the entire degradation process had been aerobic. Therefore, a measurement of the amount of oxygen consumed within the sediment in darkness will correspond quite closely to the total metabolism of organic matter going on within the sediment, since this measurement is the sum of aerobic and anaerobic degradation.
OXYGEN
The sediment oxygen consumption describes a typical bell-shaped curve,
the lowest values being found in the winter months and maximum values
from May to September (Figure
2.28). This variation corresponds closely to the variation in water
temperature. An analysis of the correlation be-tween temperature and oxygen
consumption shows that temperature explains 55% of oxygen consumption
(R2=0.5467, n=644, p<<0.0001). For the remaining part, the explanation
probably lies in the amount of organic matter reaching the sea floor during
spring and summer.
NITROGEN
The flux of nitrogen (and of phosphorus, for that matter) between the
marine sediment and the bottom water is governed by differences in concentrations
between pore water (within the sediment) and water column. Thus, sediments
will always take up NH4+ or NO3- when water-column
concentrations of the respective N compounds are greater than porewater
concentrations, and accordingly re-lease nitrogen to the bottom water
when nitrogen porewater concentrations are higher.
From January to May, estuarine sediments take up dissolved inorganic nitrogen (DIN=NH4++NO3-), primarily in the form of NO3- (Figure 2.29). During this period, the water-column concentration of NO3- is high. Therefore, the sediments NO3- uptake may be a result of a lower pore-water concentration of NO3-, perhaps governed by denitrification activity and a high NO3--assimilation by active benthic microalgae. Not until the summer months (June, July and August) does the estuarine sediment release nitrogen in the form of NH4+ (Figure 2.30). Low water-column NO3-concentrations and a high sediment oxygen demand resulting in less favourable oxygen conditions cause both nitrification and denitrification to decline markedly or stop altogether. At the same time, NO3- assimilation ceases. Thus, in the summer months, NH4+ constitutes the major part of the DIN flux from sediment to water column.
The flux of nitrogen from the sediment to the water column continues into autumn; but gradually NO3- becomes dominating in the release of nitrogen (Figure 2.29 A and B). During autumn, the sediment oxygen demand decreases (Figure 2.28), and this causes the oxygen content of the sediment to increase. This means that nitrification gains more and more importance, and that more and more NH4+ is oxidised to NO3- (nitrified) within the sediment. As benthic microalgae only assimilate insignificant amounts of NO3- during autumn because of lowered activity (see Figure 2.29 A), NO3- accumulates within the sediment, even though some denitrification is taking place, and eventually diffuses from the sediment, since water-column NO3- concentrations, at least until November, are low.
PHOSPHORUS
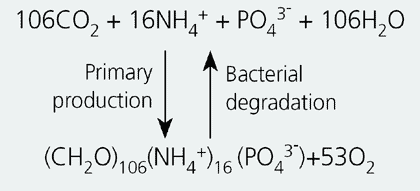
Through mineralisation, phosphorus is released as inorganic phosphate
(PO43-) (Eq. 1). Contrary to nitrogen compounds,
a considerable amount of phosphate is bound more or less permanently within
the sediment, while a smaller fraction is found dissolved in pore water.
Eq. 1
It is the pool of oxidised iron (Feox) that binds part of the phosphate found in estuarine sediment (Jensen & Thamdrup 1993). Good oxygen conditions within the sediment increases the Feox pool, which is able to retain either phosphate or hydrogen sulphide (through a reaction forming ferrous sulphide; FeS – see Eq. 2). On the other hand, poor oxygen conditions cause the pool of oxidised iron to grow gradually smaller. As the Feox concentration decreases, phosphate is released from the sediment to the water column.
Eq. 2

In the “typical” estuary the flux of PO43-
is insignificant in spring, autumn and winter (Figure
2.31). Significant PO43- release from the sediment
to the water column is seen only in June, July and August. This period
coincides with NH4+ release to the water column, and, as described
above, the release of PO43- is caused by poor oxygen
conditions within the sediment that stimulate hydrogen sulphide production,
so to speak, leading to increased consumption of oxidised iron.
INTERNAL NUTRIENT LOAD
Nation-wide observations of nutrient fluxes in Danish estuaries from Roskilde
Fjord in the east to Ringkøbing Fjord in the west show that during
the summer of 2000 (June-August) nitrogen was released from the sediment
at 14 of 17 stations (Figure 2.29 C). At almost
half of the stations an annual net release of nitrogen from the sediment
to the water column was seen in 2000, and the flux of nitrogen during
the summer months contributed most to the total net flux that year. Likewise,
a net release of phosphorus took place during the summer months at all
stations except three (Figure
2.31), and, on average, more than 75% of the total annual PO43-
release to the water column took place during this period.
It is in the summer months that water-column concentrations of nitrogen and phosphorus are low. Thus, growth of algae within the estuaries depends on a steady supply of nutrients to the water column from land (streams etc.), atmosphere, adjacent seas or through degradation of organic matter in the water column or the sediment. In June, July and August 2000, the total nutrient supply from land constituted 10% of the annual supply. Thus, a relatively low external nutrient supply during summer means that release of nitrogen and phosphorus through organic matter degradation in the sediment (the internal supply) may stimulate primary production in the estuaries at this time of year.
The internal and external supplies of nitrogen (NO3-+NH4+) and phosphorus (PO43-) to four estuaries representing four different types of area, Roskilde Fjord, Odense Fjord, Horsens Fjord and Ringkøbing Fjord, in the period June-August 2000 are shown in Table 2.8, assessed as the total supply to the entire estuary. It is evident that fluxes from the sediment of both nitrogen and phosphorus contributed significantly to the nutrient supply reaching the estuaries in the summer of 2000. In this period, between 36 and 93% of the supply of phosphorus to the estuaries came from the sediment, and in the case of nitrogen, the internal supply was almost as large (10-78%).
Table 2.8
Internal vs. external supply of N and P to four
types of estuary in the period June-August 2000.
Nitrogen |
||||
Internal |
External |
Total
|
Internal |
|
tonnes |
tonnes |
tonnes |
% |
|
| Roskilde | 387,1 |
107,8 |
494,9 |
78% |
| Odense | 17,3 |
152,6 |
169,9 |
10% |
| Horsens | 39,7 |
108,0 |
147,7 |
27% |
| Ringkøbing | 263,8 |
884,8 |
1.148,7 |
23% |
Phosphorus |
||||
Internal |
External |
Total
|
Internal |
|
tonnes
|
tonnes |
tonnes |
%
|
|
| Roskilde | 81,7 |
8,3 |
90,0 |
91% |
| Odense | 7,2 |
6,5 |
13,7 |
53% |
| Horsens | 43,1 |
3,2 |
46,3 |
93% |
| Ringkøbing | 10,3 |
18,4 |
28,7 |
36% |
| | Top | |
| Next
| |


