| Summary, conclusions and the future | ||
| Degree of nutrient enrichment | ||
| Direct effects | ||
| Indirect effects | ||
| Effectiveness of strategies and measures | ||
| Conclusions | ||
| The future | ||
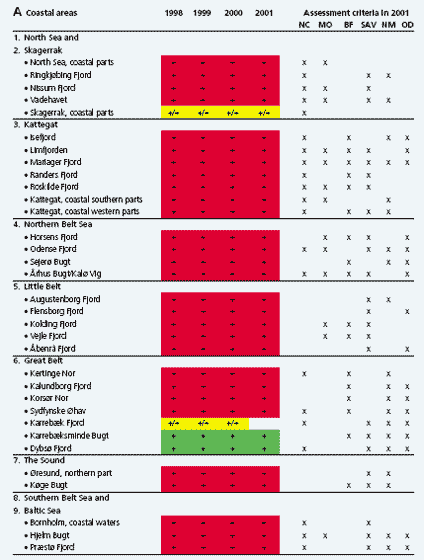
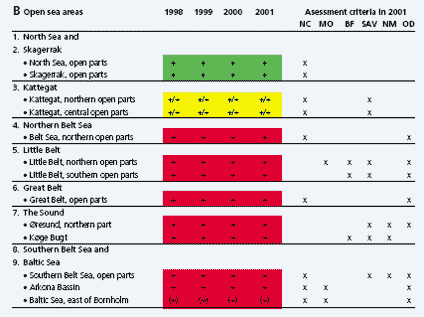
| Table
4.1 Fulfilment of objectives and assessment criteria in selected coastal areas and selected open sea areas from 1998–2001. |
| Figure 4.1 Suggested identity between eutrophication related Ecological Quality Objectives (EQOs). |
Effectiveness of strategies and measures
The national target of an 80% reduction of phosphorus from sewage plants and industry to fresh and marine waters was achieved already by 1996. The reductions of nitrogen discharges from sewage treatment plants have also been successful. The remaining and still unsolved problem is related to losses of nutrients from the agricultural sector in Denmark, even a 30% reduction in losses from the root zone has been achieved. However, this is not only the case in Denmark, as almost all countries bordering the North Sea and the Baltic Sea have so-far not been able to achieve the agreed reductions in the losses from agriculture.
It has been estimated that the Danish Action Plans on the Aquatic Environment in 2003 will result in a change in agricultural activities, which together with the reductions of discharges from industries and municipal waste water treatment plants, is likely to reduce discharges from these sources by nearly 50% (Grant et al. 2000). This corresponds to a reduction of nitrogen inputs to marine areas by at least 35%. The actual reductions in inputs to marine waters due to reductions in other sources and sectors (atmospheric emissions, scattered settlements, stormwater overflows, freshwater aquaculture, and mariculture) will be somewhat higher.
Despite the achieved reductions in the nutrient inputs to marine waters, the quality status of the majority of marine waters still does not fulfi l the general quality objective with no or only a slight impact on fl ora and fauna. However, improvements can be seen in local areas.
The Danish government has in autumn 2002 taken initiatives to start discussions on new measures to be taken to combat eutrophication. The discussions are expected mainly to focus on discharges and losses of nitrogen and phosphorus from agriculture. Until recently, phosphorus from agriculture has not been considered an important source, as most of the phosphorus was considered to be retained in the root zone. However, improved knowledge on the phosphorus cycle indicates a greater loss of phosphorus from agriculture than taken into calculation in the previous action plans.
The strategies and measures to reach the goal of a healthy marine environment must focus on a reduction of discharges, emissions and losses for all relevant sources and on ecological quality objectives for the marine environment. With regard to reductions, the Danish Action Plans on the Aquatic Environment focus on the major sources in order to achieve cost/effective reductions. However, future action plans should include all relevant sources. With regard to ecological quality objectives, the Danish objectives from 1984 are normative. They have to be operational and expressed as numbers and values. This will be done as an integral part of the Danish implementation of the Water Framework Directive. This directive is a major player in the years to come. A successful implementation is a prerequisite for an informed management of marine eutrophication. The implementation process should not overlook the Habitat Directive and the work within HELCOM and OSPAR together with the future EU Marine Strategy. The quality objectives should be parallel as illustrated in Figure 4.1.
Table 4.1 A + B
Fulfilment of objectives and assessment
criteria in selected coastal areas (A) and selected open sea areas (B)
from 1998–2001. The assessment criteria are:
NC –
Nutrient concentrations
MO –
Mass occurrence of algae
BF –
Benthic fauna
SAV –
Submerged aquatic vegetation
NM –
Annual nuisance macroalgae
OD –
Oxygen depletion
| EQOs impaired | ÷ |
| EQOs close to fulfilment | +/÷ |
| EQOs fulfilled | + |
Based on Ærtebjerg et al. 2002. Updated versions of the tables can be found in Rasmussen 2003 (in danish).

Figure 4.1
Suggested identity between eutrophication related Ecological Quality Objectives
(EQOs) according to OSPAR Comprehensive Procedure (COMP), the existing
Danish Aquatic Environmental Planning System (AEPS), the Water Framework
Directive (WFD), the Habitat Directive and the future EU Marine Strategy.
(Modified from OSPAR ETG 01/7/1, Annex 6, 2001; Henriksen et al. 2001
and Pedersen et al. 2001).
|
||||||||
| OSPAR COMP | Non-Problem Area | Problem Area | ||||||
| Danish AEPS | Compliance | Non-Compliance (or Accommodated) | ||||||
| EU Water Framework Directive | High | Good | Moderate | Poor | Bad | |||
| EU Habitats Directive | Favourable Conservation Status | Unfavourable Conservation Status | ||||||
| EU Urban Wastewater Directive | Less sensitive areas | Sensitive areas | ||||||
| EU Nitrates Directive | Less vulnerable zones | Vulnerable zones | ||||||
| EU Marine Strategy | Compliance with goals | Impaired ecosystem health | ||||||
|
||||||||
| | Top | |
| Next
| |


