
| Map of Danish marine waters | ||
| Nutrient concentrations | ||
| Nutrient ratios | ||
| Nutrient limitations | ||
| Conclusion | ||
| Figures
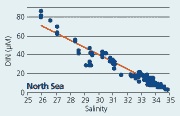
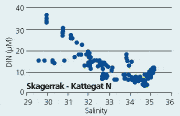
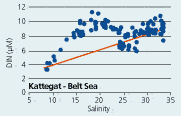
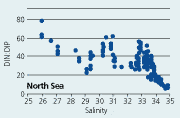
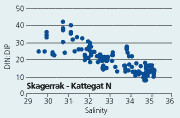
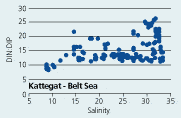
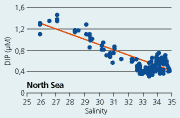
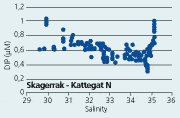
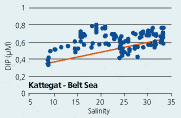
2.13 Relations of DIN, DIP and DIN:DIP ratio to salinity in February 2002 in the North Sea, Skagerrak and Kattegat-Belt Sea, respectively. The lines in the North Sea plots are linear regression lines, while the lines in the Kattegat-Belt Sea plots are theoretical mixing lines for mixtures of Baltic water and Skagerrak water. |
| DIN, North Sea |
 |
| DIN, Skagerrak-Kattegat N |
 |
| DIN, Kattegat-Belt Sea |
 |
| DIN:DIP, North Sea |
 |
| DIN:DIP, Skagerrak-Kattegat |
 |
| DIN:DIP, Kattegat-Belt Sea |
 |
| DIP, North Sea |
 |
| DIP, Skagerrak-Kattegat |
 |
| DIP, Kattegat-Belt Sea |
 |
| Figures
2.14 Indices for annual mean concentrations of DIN, TN, DIP, TP and the DIN:DIP ratio (upper figure), as well as the same indices corrected for runoff variations (lower figure). 95% confidence limits are given for the uncorrected indices. Estuaries and coastal waters are shown with blue circles, and open Kattegat-Belt Sea with red triangels |
| DIN - Estuaries and coastal waters |
 |
| DIN - Kattegat-Belt Sea |
 |
| TN |
 |
| DIP |
 |
| TP |
 |
| DIN:DIP |
 |
| Figures
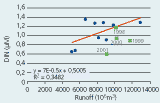
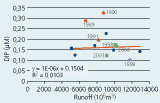
2.15 Annual mean indices for DIN and DIP in estuaries-coastal waters and open Kattegat-Belt Sea against runoff. The years 1998–2001 are marked with green squares, and the years 1989–1991 are marked with red triangles in the DIP diagrams. |
| DIN, estuaries-coastal waters |
 |
| DIN, Kattegat-Belt Sea |
 |
| DIP, estuaries-coastal waters |
 |
| DIP, Kattegat-Belt Sea |
 |
Nutrient concentrations, nutrient ratios and nutrient limitations
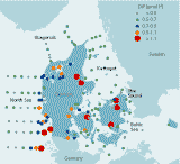
According to the definition of eutrophication, eutrophication is caused by enrichment of the water by inorganic nutrients. In the Baltic water entering the Danish straits both winter nitrate and phosphate concentrations have about doubled from 1970 to the mid 1980s (Nausch et al. 1999). The same is the case for water entering from the German Bight to Danish North Sea waters with the Jutland Coastal Current (Hickel et al. 1995). In the Kattegat surface water the winter nitrate and phosphate concentrations have increased about 40% in the period 1971–1990 (Andersson 1996).
NUTRIENT CONCENTRATIONS
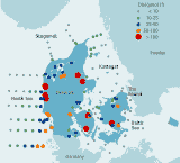
The lowest nutrient concentrations in Danish waters are observed in the
Baltic Sea, and the highest in open waters are found in the German Bight
of the North Sea. In the estuaries and coastal waters the concentrations
vary from lower concentrations similar to what is found in open waters
to high levels in estuaries with long residence times and high nutrient
loads (Figure 2.12). The geographical variation
of inorganic nitrogen nutrients (DIN = NO3-N + NO2-N
+ NH4-N) is much larger (range factor 70) than for phosphate
(DIP = PO4-P) (factor 20).
| Figure
2.12 Mean winter concentrations of DIN and DIP, 1998–2001, in Danish marine waters. |
||
 |
 |
|
| DIN | DIP |
The water in the Danish North Sea is essentially a mixture of two water masses: freshwater from the rivers to the southern North Sea and German Bight with high nutrient concentrations, and central North Sea water with high salinity (34–34.5) and low in nutrients. Therefore, the winter nutrient concentrations generally show an inverse linear correlation to the salinity (Figures 2.13). Likewise, the water in the Kattegat and Belt Sea essentially is a mixture of Baltic Sea surface water with low salinity (~8) and nutrient concentrations, and Skagerrak water with high salinity (34–35) and higher nutrient concentrations. However, the winter nutrient concentrations in the Kattegat and Belt Sea show a positive deviation from a linear relationship in the salinity interval 10–25, due to local supplies of nutrients in the Belt Sea and Kattegat. Freshwater runoff is too small compared to the Baltic outflow to influence the salinity significantly in the Belt Sea and Kattegat. In Skagerrak many different water masses and mixtures between them may be present: Jutland Coastal Current water from the German Bight (salinity 30–33), central North Sea water, North Atlantic water (salinity ~35), Kattegat surface water and locally influenced coastal waters (Figures 2.13). The water in the estuaries is generally a mixture between local freshwater runoff and coastal seawater from outside the estuary.
For assessing the development of nutrient concentrations in Danish waters indices for mean annual concentrations of DIN, TN, DIP and TP in the upper mixed layer were developed for estuaries-coastal waters and the open Kattegat–Belt Sea, respectively (see box 4).
The indices for DIN and TN generally fluctuated around a constant level during the period 1989–2001, in both the estuaries–coastal waters and the open Kattegat-Belt Sea (except for a weak decreasing tendency for DIN in open waters). However, low concentrations were observed in the very dry years 1996 and 1997, when the land-based nitrogen load was about half of normal. The indices for DIP and TP decreased significantly in the estuaries–coastal waters, but was less pronounced in the open Kattegat–Belt Sea through the period 1989-2001 (Figures 2.14).
Freshwater runoff is the most important factor affecting nutrient concentrations in Danish waters. In estuaries and coastal waters the correlations between the indices for annual mean DIN and TN concentrations and runoff were highly significant for the period 1989–97 (Figure 2.15). The years 1998–2001 deviate from this, as the DIN and TN concentrations in Danish streams decreased during this period (Bøgestrand 2001). Likewise, significant correlations were found for DIP and TP in estuaries and coastal waters for the period 1992–1997. The years 1989–1991 were omitted as significant reductions in the phosphorus point source load took place in these years. In the open Kattegat–Belt Sea significant correlations were also found for DIN and TN, but not for DIP and TP. However, all the annual mean nutrient indices were corrected for runoff variations according to the correlations observed.
In the estuaries and coastal waters the DIN and TN indices normalised to mean runoff show a significant decrease in the later years 1998–2001, and the normalised DIP and TP indices have reached a constant low level in the same years. In the open Kattegat–Belt Sea the normalised indices for DIN, DIP and TP show a slow decrease over the whole period 1989–2001 (Figures 2.14).
NUTRIENT RATIOS
The optimal DIN:DIP ratio (N/P-ratio) for phytoplankton growth is 16:1
(based on molar concentrations) and is called the Redfield ratio. Significant
deviations from 16 at low N/P-ratios might indicate potential nitrogen
limitation and at high N/P-ratios potential phosphorus limitation of phytoplankton
primary production. This might affect the biological state of the ecosystem,
in particular the phytoplankton biomass, species composition and eventually
food web dynamics.
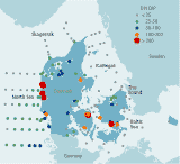
In the open Belt Sea and Kattegat the N/P-ratio based on winter DIN and DIP concentrations is generally between 10 and 20 and thus does not deviate much from the Redfield ratio. In the North Sea the N/P-ratio is generally high ranging between 25 and 60, except in the saline central North Sea. In the Skagerrak N/P-ratios are also high at salinities lower than 33 (Figures 2.13 and 2.16). Generally the winter N/P-ratio in estuaries is high (>25) to very high (>100) (Figure 2.16).
N/P-ratios based on annual mean DIN and DIP indices in the estuaries-coastal waters show an increase from 1989 to 1998 parallel to the reduction in phosphorus load, and then a decrease to 2001 parallel to the decrease in nitrogen load per unit runoff. In the very dry years of 1996-97 with low nitrogen load the uncorrected N/P-ratio indices were much lower than in neighbouring years (Figures 2.14). In the open Kattegat-Belt Sea no general development is observed in the annual DIN:DIP indices during the period 1989–2001.
| Figure 2.16 |
 |
|
Mean winter DIN:DIP ratio 1998–2001 in Danish marine waters.
|
NUTRIENT LIMITATIONS
A simple first order approach to assess potential nutrient limitation
is to examine for time periods when nutrient concentrations are below
the theoretical half-saturation constant (Ks)
for uptake and to compare the stoichiometry to expected Redfield ratios.
While crude, this has been found to be a robust approach to determine
which nutrient is most limiting. The Ks values used are 2 µM for
DIN, 0.2 µM for DIP and 2 µM for DSi (Fisher
et al. 1992) and Redfield ratio is 16 for DIN:DIP.
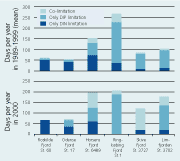
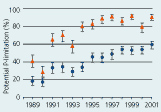
In estuaries phytoplankton primary production is often potentially limited by low phosphate concentrations early in the productive season. In 2000 potential phosphate limitation in 6 estuaries extended from about 1 month in Horsens Fjord and Odense Fjord to 3 months in Skive Fjord and Limfjorden and up to 6 months in Ringkøbing Fjord. While no potential phosphate limitation was observed in Roskilde Fjord. Potential co-limitation by low concentrations of both DIN and phosphate was most pronounced in Horsens Fjord for a period of about 2 months. The estuaries, except Ringkøbing Fjord, were potentially nitrogen limited in late summer for one to two months (Figure 2.17A) (Henriksen et al. 2001). The number of days with potential phosphate limitation has increased significantly in the estuaries since the early 1990s parallel to the decrease in phosphorus load from land (Figures 2.17).
| Figure
2.17A |
Figure 2.17B | |
 |
 |
|
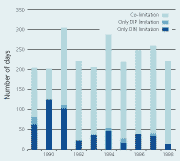
| The number of days with potential nutrient limitation of the phytoplankton primary production given as mean for the period 1989–1999 (upper panel) and in 2000 (lower panel) in 6 Danish estuaries: Roskilde Fjord, Odense Fjord, Horsens Fjord, Ringkøbing Fjord, Skive Fjord and Limfjorden. (From Henriksen et al. 2001). | The number of days with potential nutrient limitation in the productive season in the years 1989–1998 at station 925 in the south-western Kattegat. (From HELCOM 2002). |
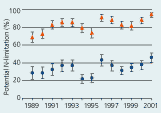
Both nutrient concentrations and nutrient ratios suggest that DIN continues to be the nutrient potentially most limiting to phytoplankton biomass in the Kattegat and Belt Sea (Figure 2.17B). Phytoplankton were mostly potentially co-limited by DIN and DIP concentrations or limited by DIN concentrations (Ærtebjerg et al., 1998). Redfield ratios suggest that when phytoplankton were co-limited by DIN and DIP, that DIN is most often the most potentially limiting nutrient. Although phosphate was potentially limiting by itself only for limited periods each year, the periods that the open sea areas are co-limited by low concentrations of DIN and DIP has significantly increased with time (Figure 2.18). Dissolved silicate concentrations are occasionally low enough (<2 µM) to limit diatom populations.
| Figure
2.18 |
||
 |
 |
|
| Indices for potential N limitation (left/top) and P limitation (right/bottom) of the phytoplankton primary production in the productive period March-September calculated as the probability of obtaining DIN or DIP concentrations below the theoretical half-saturation constants (Ks) for uptake. Indices for estuaries-coastal waters shown with blue circles, and for open Kattegat-Belt Sea with red triangels. | ||
CONCLUSION
Improvement of the ecological state of the Danish marine waters calls
for further reduction in the nitrogen load, as the primary production
in the open Kattegat and Belt Sea is mainly nitrogen limited and the production
in the estuaries is most often nitrogen limited during late summer and
autumn. Further reduction in the phosphorus load to the open Kattegat
and Belt Sea will probably have insignificant effect as phosphorus is
seldom the most limiting nutrient, and because the phosphorus contributions
from internal processes and neighbouring seas are large compared to the
load from land (Rasmussen et al., 2003).
However, in the estuaries phosphorus limitation of the primary production
in spring and early summer is pronounced and has increased after the substantial
phosphorus load reductions in the early 1990s. Further reduction of the
phosphorus load to the estuaries might further improve the environmental
state.
| Box 4 Indices for annual mean levels of nutrients |
| Annual mean levels of nutrient
concentrations were calculated by means of 3-factor analysis-of-variance
(ANOVA) after log-transformation. The 3-factor ANOVA described variations
between individual stations, years and months as categorical factors.
The assumptions of the ANOVA were that seasonal and interannual variations
in nutrient concentrations were similar at all stations, deviating
only by a scaling factor. The marginal distribution of yearly means were calculated and back-transformed into original scale to provide yearly indices for the mean annual nutrient concentration of all stations included in the analysis. The marginal yearly means correspond to yearly averages if monitoring data was balanced, that is equal number of observations for each month, each year at each station. The yearly nutrient mean levels were calculated by means of PROC GLM in SAS/STAT. |
| | Top | |
| Next
| |


