|
|
|
THOR - an Integrated Air Pollution Forecasting and Scenario Management System
A direct web address to the current page is thor.dmu.dk
 |
Since 2011 NERI / ATMI is now Aarhus University
|
|
As per 1 July 2011 the National Environmental Research Institute (NERI) has been closed down. The research activities at the former Department of Atmospheric Environment are now gathered at the Department of Environmental Science under Aarhus University. The information available at www.neri.dk and www.dmu.dk will be rearranged accordingly in the coming months. The webpage below is not yet updated and still the old names (NERI / ATMI) are used many places.
Read more...
|
|
November 2003: International environmental award for the THOR system
|
|
A prestigious international award has been presented to the National Environmental Research
Institute (NERI), Denmark for the THOR system.
NERI was the Gold Winner of the International Green Apple Awards for Environmental Best Practice, 2003.
Read more...
|
|
System overview
|
|
Since 1996, the National Environmental Research Institute (NERI),
Denmark, has developed a comprehensive and unique integrated air
pollution model system, THOR. The model system includes several
meteorological and air pollution models capable of operating for
different applications and different scales. The system is capable of
accurate and high resolution three-days forecasting of weather and air
pollution from regional scale over urban background scale and down to
individual street canyons in cities - on both sides of the streets.
Coupling models over different scales makes it possible to account for
contributions from local, near-local as well as remote emission
sources in order to describe the air quality at a specific location -
e.g. in a street canyon or in a park. The system is used in connection
with the urban and background monitoring programs in Denmark.
Furthermore, the system can be used to forecast air pollution from
accidental releases as e.g. power plants, industrial sites and natural
or human made fires.
The main purposes of the THOR system are forecasting, nowcasting,
emission reduction scenarios, retrospective analyses and air pollution
assessments and management. The system can be used for information and
warning of the public in cases of high air pollution levels and for
policy management (e.g. by emission reduction or traffic scenarios) of
many different chemical compounds. The system can be applied
operationally for any location all over the world. The system consists
of several different air pollution models - all developed at NERI
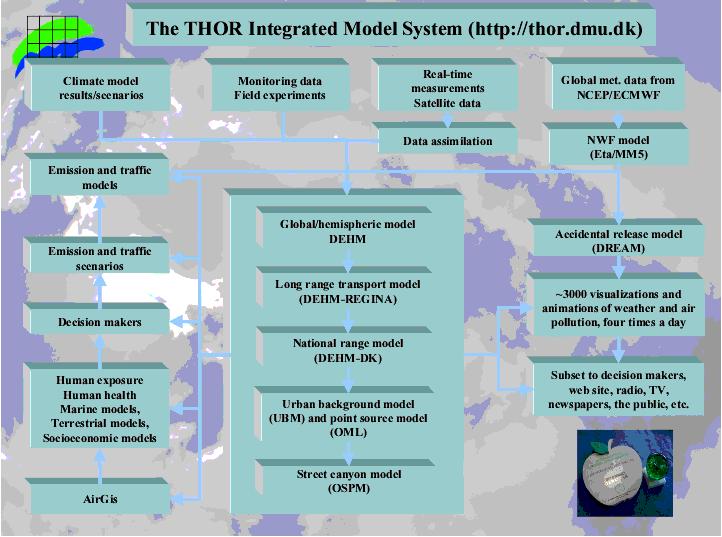
during the last decades. A schematic diagram of the different modules
and the data flow chart of the THOR system is shown in the figure
below. The model system consists of a coupling of several models,
briefly described in the following.
|
|
|
Applications
|
|
Present capabilities of the THOR system include all aspects within
forecasting, nowcasting, supplement to monitoring programs, scenarios,
retrospective analyses, assessment and management of air pollution.
Some examples are:
-
Three-day high-resolution regional weather forecasts.
-
Three-day regional air pollution forecasts of 56 chemical
compounds, e.g. ozone, sulphur, nitrate, particles, etc.
-
Three-day urban background air quality in specifically identified
cities.
-
Three-day urban air quality forecasts at street level - at both
sides of the streets.
-
Three-day forecasts of accidental releases into the atmosphere from
e.g. nuclear power plants, fires, chemical industries, etc.
-
Emission and traffic reduction scenarios for air pollution
management and decision making.
-
Multiple-point and area source dispersion modelling, for
determining the effects on air quality caused by proposed new
emission sources (e.g., new power plants, chemical industries,
commercial activities).
-
Automated production of data, visualizations (maps and time
series), information and warnings.
-
Data, forecasts and warnings are disseminated to the authorities
and decision makers.
-
Data can be disseminated to the public via Internet or other media.
|
|
|
The weather forecast
|
|
A three-dimensional numerical weather forecast model, Eta, is applied.
This model is initialized with data from a global circulation model,
run at the National Centers for Environmental Prediction, NCEP, USA.
Data from this global circulation model are the starting point for
nearly all weather forecasts in the USA, and for many forecasts in
Europe (e.g., Belgium, Greece, Yugoslavia and Iceland). The spatial
resolution of the weather forecast model is e.g. 39 km x 39 km over
the global grid and 10 km x 10 km over a sub-domain (see the two
figures below for an example). Three-dimensional information on winds,
temperature, humidity, clouds, precipitation, turbulent fluxes,
radiation, etc. can be visualized e.g. every six hours as maps and
e.g. every one hour as time series for specific locations. The figures
below show the precipitation and surface pressure on November
12th, 2002 for Europe and Denmark.
|
|
|
The long-range transported air pollution
|
|
The weather forecast is used as input to a long-range transport air
pollution model, the Danish Eulerian Hemispheric Model, DEHM,
producing air pollution forecasts on regional background scale (e.g.
the greater European scale). The operational version of the model
calculates transport, dispersion, deposition and chemistry (including
photochemistry) of 56 chemical compounds. Furthermore, the model can
be used to describe and forecast sand/dust storms. The emission data
used in DEHM are derived from a combination of information provided by
the European Monitoring and Evaluation Programme (EMEP) and global
emission databases. The two figures below show concentrations of
nitrogen-dioxide over Europe and Denmark on November 12th,
2002.
|
|
|
Air pollution in the urban background
|
|
Meteorological data from the weather forecast and air pollution
concentrations from the long-range transport model are subsequently
used as input to the Urban Background Model, UBM, calculating the
urban background air pollution based on emission inventories with a
spatial resolution down to one kilometer. The model is e.g. run
operationally for the central city of Copenhagen and for the city area
of Aalborg, Denmark, and the results of these calculations are
published on the Internet four times each day. The UBM model, in the
version presently applied in Denmark, is suitable for calculations of
urban background concentrations when the dominating source is the road
traffic and/or large point sources. The two figures below show
concentrations of nitrogen-dioxide over the city of Aalborg (upper
figure) and the city of Copenhagen (lower figure).
|
|
|
Air pollution in street canyons
|
|
The output from the urban background model is used as input to the
Operational Street Pollution Model, OSPM, producing the air pollution
concentrations at street level at both sides of the streets in cities.
The model calculates air concentrations of NO, NO2,
NOx, O3, CO and benzene in the street canyon at
both sides of the street. Particles will be included in the model in
the near future. The OSPM has been successfully tested under specific
European field campaigns in a variety of different climatic and air
quality conditions in, e.g., Copenhagen, Gothenburg, Helsinki, Oslo,
Brussels, Berlin, Hanover, and Milano. It has also been tested and
applied in Beijing, China, under a cooperation agreement with Tsinghua
University.
Due to the circulation of air in street canyons (see the figure
above), the air pollution concentrations can be very different at the
two sides of a street. This is illustrated in the two sets of figures below. The
upper set of figures show a three-day forecast of air pollution
concentrations at the eastern and western side of a street in
Copenhagen for different chemical compounds. Depending on the
meteorological situation, the concentration levels are very different.
In the lower set of figure, the maximum value of the two sides of the street
is visualized as colored levels. Blue indicates concentrations below
mean, green indicates mean concentrations, and red indicates air
pollution concentrations above mean.
 -->
-->
|
|
|
Local scale releases from point sources
|
|
In addition to urban air quality forecasting, the multi-point (plus
area source) dispersion model, OML, has been integrated into the THOR
system. This new feature is based on the coupling of the OML point and
area dispersion model to the urban background model (UBM). The OML
model is the standard model for routine regulatory applications
according to the guidelines issued by the Danish Environmental
Protection Agency.
Thus, it is used for estimating
the optimal heights of industrial stacks. OML is a local-scale
operational air pollution model for estimating dispersion of a
passive, or possibly buoyant, gas from strong point and area sources.
It can be applied to distances up to approximately 30 km from the
source. In the figure below, the air pollution from two distinct
sources in the city of Aalborg is shown as an example.
|
|
|
Large scale releases from point sources
|
|
Furthermore, the weather forecast drives the Danish Rimpuff and
Eulerian Accidental release Model, DREAM, used in connection with
accidental releases at greater scales as e.g. the Chernobyl accident.
DREAM is a combined Lagrangian and Eulerian model, where the
Lagrangian part handles the initial near-source transport and
dispersion (up to ~300 km from the source) and the Eulerian part
calculates transport and dispersion in an area covering e.g. Europe.
The model can be used for any accidental release from power plants,
industrial sites, natural and human made fires, etc. The first of the two figures
below shows the radioactive concentrations of 137Cs, 10
days after the Chernobyl accident. The second figure shows the total
deposition of 137Cs some weeks after the Chernobyl
accident.
|
|
|
Operational procedure and comparison to measurements
|
|
The entire THOR system is currently run operationally, up to four times
every day, initiated with data at 00 UTC, 06 UTC, 12 UTC and 18 UTC.
The system is fully automated - meaning that the entire procedure of
receiving the data, running the models, producing the visualizations
and sending the specified results to the end-users is controlled by
automated procedures. The operational performance of the system is
monitored every day. The whole system and the operational procedure
have been run, tested and validated since August 1998.
Example of comparison of some model results with measurements as time
series for January 2000 is given in the two figures above. The upper
figure shows a comparison of hourly values of measured meteorological
parameters in the city of Aalborg, Denmark, and the weather forecast.
The lower figure shows a comparison of hourly values of measured
concentrations and the air pollution forecast using the Operational
Street Pollution Model at the street Vesterbro, Aalborg. As seen in
the figures, the models produce very accurate forecasts of both
weather and air pollution parameters.
|
|
|
Dissemination of results to end-users
|
|
All weather and air pollution data from the system can be disseminated
to the authorities, decision-makers and the public. The raw data can
be displayed as maps or as time series. Furthermore, information about
exceedances of critical air pollution levels can be extracted and
displayed as color codes or given as compressed information, as e.g.
"below mean", "mean", "above mean",
"high" or "warning". An example is given below for
the inner city of Aalborg, Denmark. The home page (in Danish) displays
the air pollution at ten streets in the city center, which are colored
according to the five possible information levels described above.
Furthermore, time series including the air pollution concentrations
are given below the city map for detailed information.
|
|
|
Further Information, please contact:
|
|
Jørgen Brandt, PhD, Head of Section, Senior Scientist,
Geophysicist
University of Aarhus, Department of Environmental Science
Frederiksborgvej 399, P.O.Box 358, DK-4000 Roskilde, Denmark
E-mail: jbr@dmu.dk
Phone: +45 8715 8522
|
|
Links
|
|
For a demonstration of some of the output from the THOR system: http://www.dmu.dk/THORBEN/
Link to the most recent 3-day forecast (in Danish).
Link to the system operated by the City of Copenhagen.
Link to the system operated by the City and County of Swansea - UK.
|
|

